Red Candle Meaning Explained: A Key Indicator in Crypto and Stock Trading
Candlestick charts are widely used for technical analysis in both cryptocurrency and stock trading. A red candlestick typically signals that the price has dropped during a certain period. A red candlestick appears when the opening price is higher than the closing price, indicating that sellers dominated the market during that period.
Red Candlestick: Fundamental Concepts
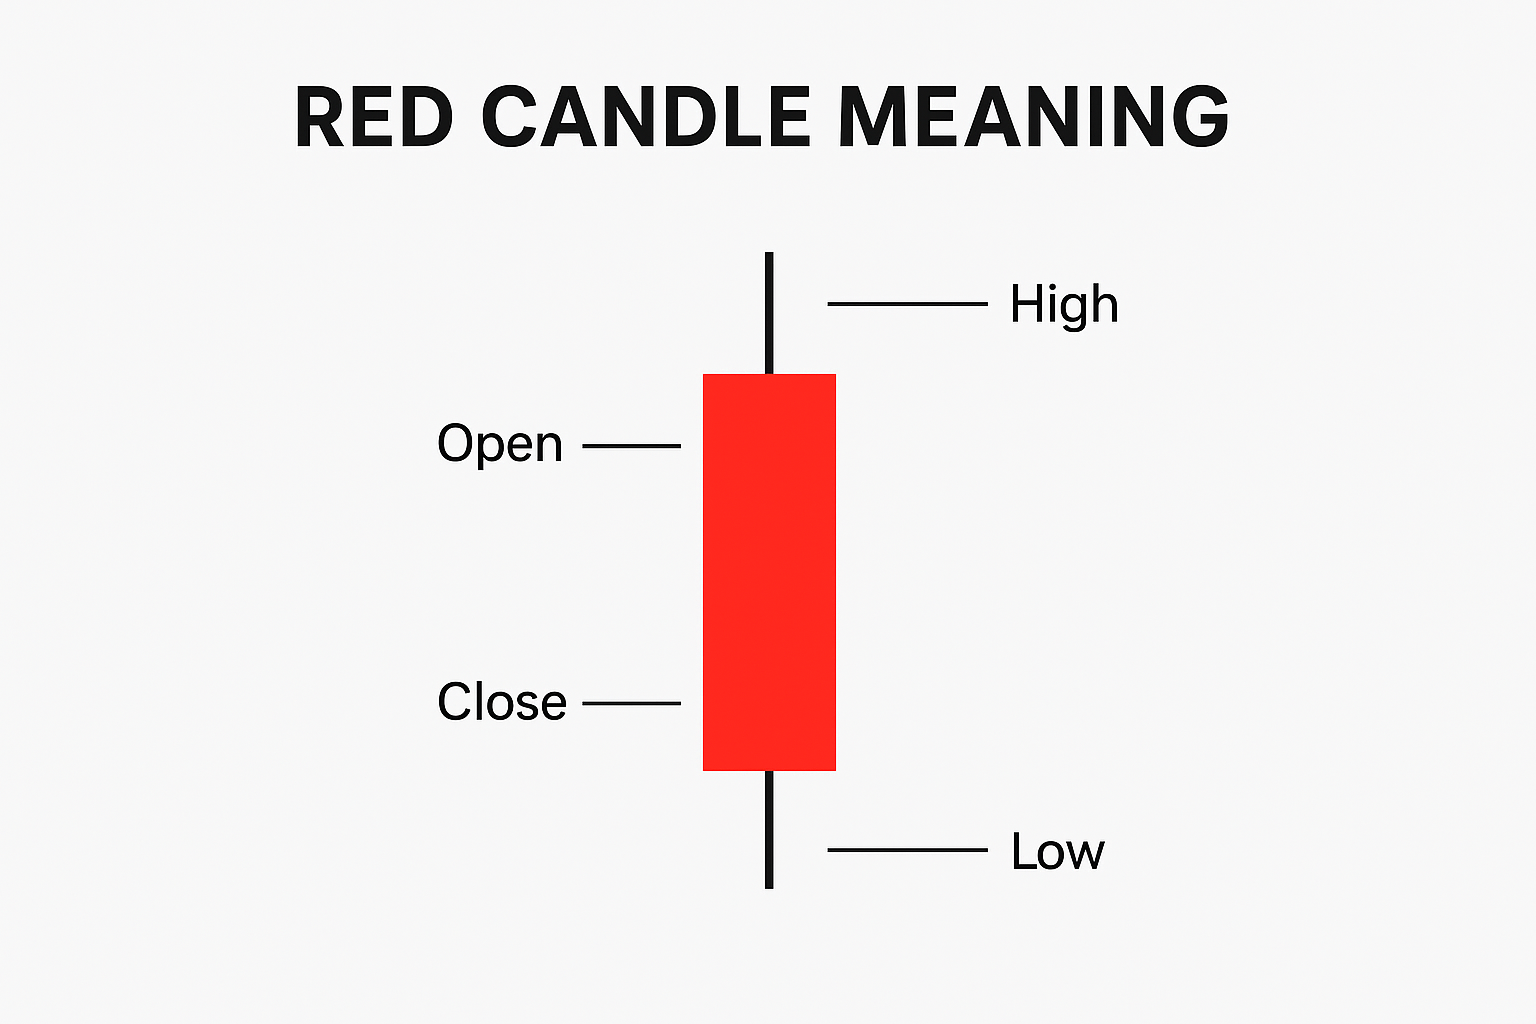
Each candlestick shows the opening, closing, highest, and lowest prices. When the closing price falls below the opening price, the chart displays a red candlestick. In the crypto market, red candlesticks provide a clear visual representation of investor sentiment and market movement.
Market Signals of Red Candlesticks
A red candlestick does not always indicate a strictly bearish signal. For instance, a long red candlestick may reflect heavy selling pressure, but it could also suggest that the price is nearing a support level. After several consecutive red candlesticks, the market may rebound and enter what is known as an oversold zone. Investors should use additional indicators—such as RSI or moving averages—to better assess the broader market trend.
Red Candlesticks in Technical Analysis
Red candlesticks play a key role in technical analysis by helping identify trend reversals and support or resistance levels. For example, if a large red candlestick appears after a prolonged uptrend, it may signal that the uptrend is pausing or reversing. Likewise, a small red candlestick during a downtrend could indicate easing selling pressure, which may present a potential buying opportunity.
Red Candlesticks and Trading Strategies
Understanding red candlesticks can help traders develop more disciplined strategies.
- Short-term trading: Use red candlesticks to identify pullbacks and make quick trades.
- Trend following: Multiple consecutive red candlesticks can confirm a downward trend and help traders avoid impulsive buying.
- Risk management: Red candlesticks can act as stop-loss signals, which support better risk control.
Common Pitfalls and Key Considerations
Many beginners mistakenly see a red candlestick as an automatic “sell signal,” when in reality, it is only one aspect of market information. Sound investment decisions should consider the overall trend, trading volume, and other technical indicators, not just one red candlestick.
In summary, understanding red candlesticks is crucial for analyzing market trends. Accurate interpretation empowers traders to fine-tune their entry and exit points. This helps maximize investment effectiveness.
Related Articles

Pi Coin Transaction Guide: How to Transfer to Gate.io

What is N2: An AI-Driven Layer 2 Solution

Grok AI, GrokCoin & Grok: the Hype and Reality

How to Sell Pi Coin: A Beginner's Guide

Crypto Trends in 2025
